
Research, Evidence & Performance
A Strategy Built Through Research, Testing, and Verification
What you see today is the result of more than a year of systematic research into sports market inefficiencies.
Before capital was deployed, we focused on data quality, robustness, and repeatability, not short-term results.
Our objective was simple but demanding:
Build a strategy that remains profitable across time, across market conditions, and across inevitable variance.
1. Research, Analysis & Methodology
Data Collection & Preparation
Historical match data and pricing across multiple leagues and seasons
Full normalization of results into a consistent, bet-level dataset
Focus on net outcomes, not headline win rates
Strategy Exploration
Multiple strategy variants were tested, including:
Different market types
Alternative signal filters
Varying stake allocation methods
Conservative vs aggressive execution rules
Each iteration was evaluated on:
Expected value
Drawdown behavior
Sensitivity to variance
Stability across time windows
Only strategies that survived strict robustness filters were retained.
2. Why This Strategy Survived When Others Did Not
Many strategies look attractive in isolated samples.
Most fail when exposed to:
Different months
Changing market liquidity
Unfavorable sequencing of results
The final strategy was selected because it demonstrated:
Positive expectancy across large samples
Controlled drawdowns under realistic assumptions
Resilience to adverse run distributions
This is a process-driven selection, not result-driven cherry-picking.
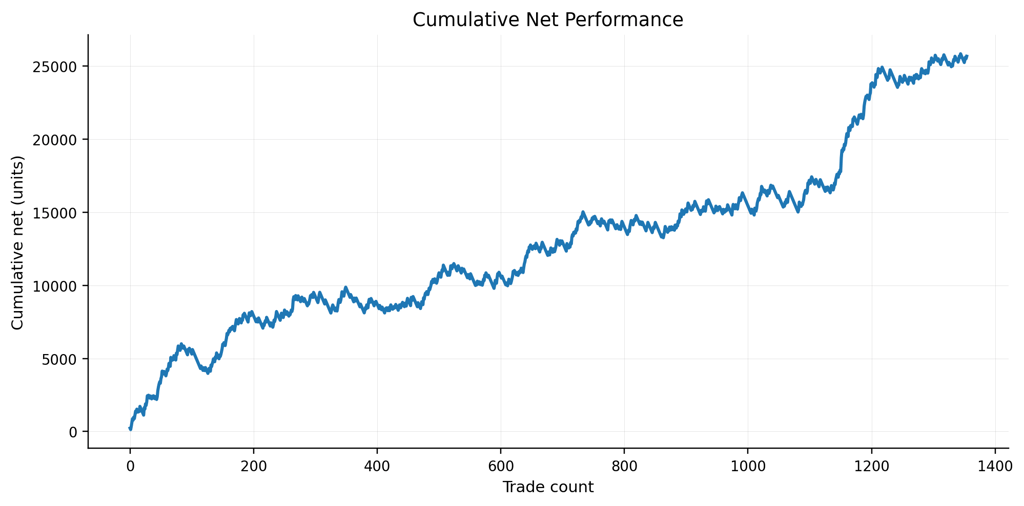
This chart shows the cumulative net result derived from historical trade data, using a fixed reference stake per trade. Results are presented for informational purposes only and reflect past observations. Past performance is not indicative of future results.
3. Historical Performance Applied Retrospectively
Back-Application to the Previous Year
The final version of the strategy was applied to last year’s data as if it had been running live, using:
Fixed, rule-based execution
No hindsight adjustments
No parameter tuning after the fact
This produced:
Consistent profitability across the year
Expected short-term volatility
Clear evidence of long-term edge
4. Understanding Variability: Good Months and Bad Months
Short-term variability is unavoidable in any probabilistic strategy.
To address this honestly, we analyzed performance by calendar month and by rolling periods, rather than relying on annual aggregates.
Key findings:
Some months consistently outperform
Some months introduce higher variance
Annual performance is not dependent on perfect monthly consistency
This is expected in a statistically sound system.
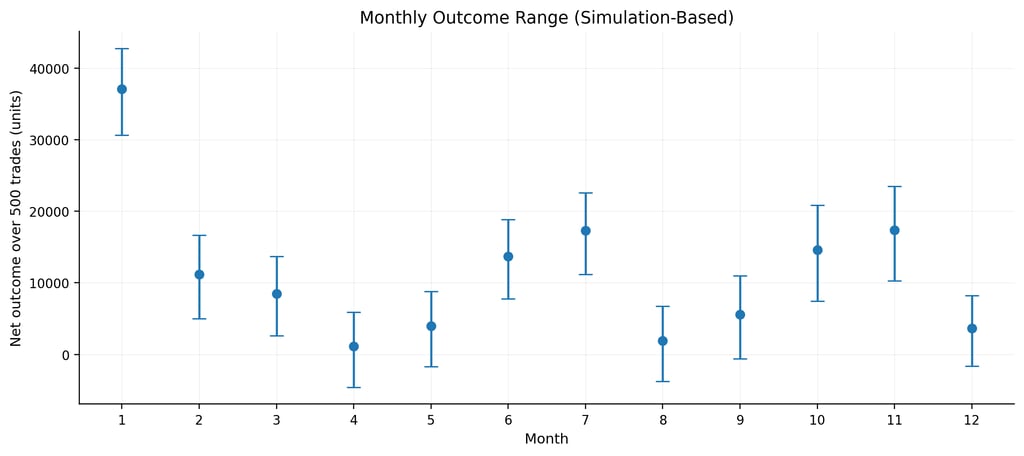
This chart summarises simulation-based estimates of outcomes over a fixed number of trades, analysed independently for each calendar month. Results are derived from resampling historical trade outcomes and are intended to illustrate variability and seasonality. Extreme upside outcomes have been excluded to avoid distortion.
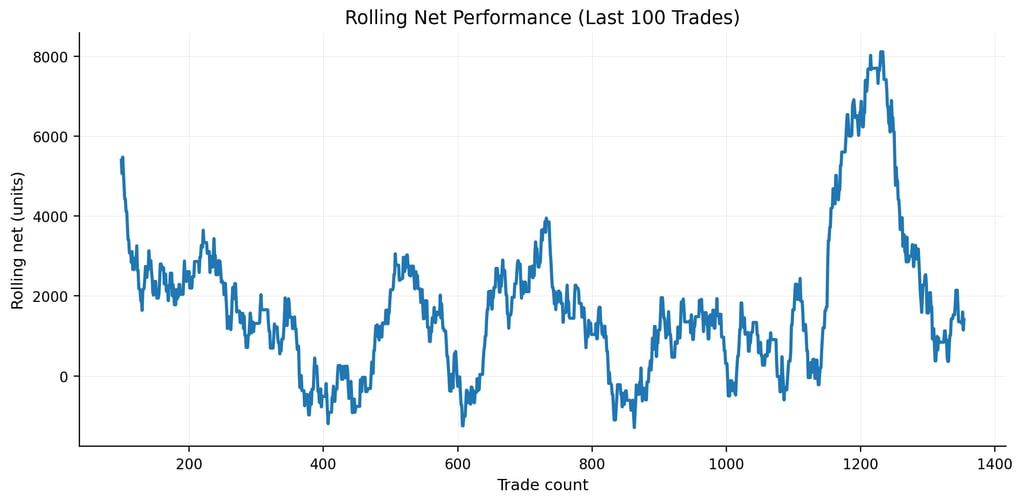

Rolling net results calculated over a fixed number of trades illustrate short-term variability and drawdowns that may occur during normal operation of the strategy. Periodic fluctuations are expected in probabilistic trading systems
5. Monte Carlo Analysis: Stress-Testing the Strategy
To move beyond historical sequencing, we applied Monte Carlo simulations to the strategy.
What We Tested
We simulated 10,000 different “years”, where each year consists of:
1,000 trades
Fixed stake of 100 units per trade
Trades are drawn from the historical distribution of real results
No leverage, no compounding assumptions
Each simulation represents a plausible alternative year, not a forecast
Why Monte Carlo Matters
Historical results show what happened once.
Monte Carlo shows what can reasonably happen many times.
This allows us to:
Estimate realistic return ranges
Quantify drawdown probabilities
Understand capital stress scenarios
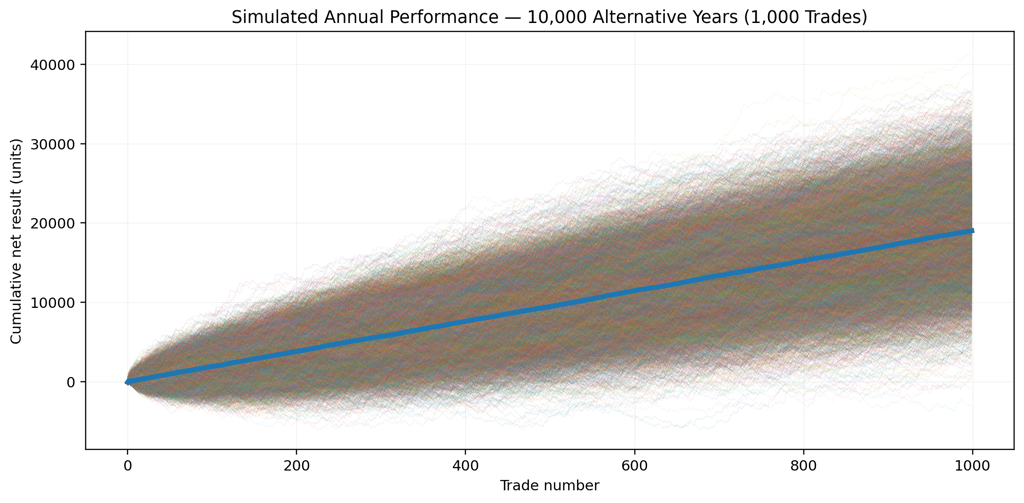

Each thin line represents a simulated annual performance path generated by re-sequencing historical trade outcomes over a fixed number of trades. The bold line represents the median outcome across all simulations. This analysis is intended to illustrate potential variability of results under different trade sequences and does not constitute a prediction of future performance.
6. Annual Perspective: Why the Strategy Works Over Time
The strategy is not designed to “win every month”.
It is designed so that:
Strong months more than compensate weaker ones
Profitable periods compound faster than losses detract
Capital growth is driven by edge + discipline, not leverage
Typical annual outcomes remain strongly positive
Variance smooths over sufficient sample sizes
Conservative stake sizing materially reduces capital stress
7. Ongoing Monitoring & Governance
Research does not stop at deployment.
The strategy is continuously monitored for:
Deviation from expected behavior
Structural changes in market conditions
Risk concentration across time or leagues
Adjustments are made only when justified by data, not short-term outcomes.